
PRIOR TO THE INITIATION OF THE 2016 PRESIDENTIAL ELECTION CYCLE, I HAD MADE A PREDICTION, PUBLISHED IN THE DECEMBER, 2015 EDITION OF http://www.verocommunique.com THAT THE 2016 PRESIDENTIAL ELECTION WOULD BE CARRIED BY THE DEMOCRATIC NOMINEE BY AN ELECTORAL COLLEGE VOTE OF 347 TO 191.
The reason for making this early prediction was to build support for my premise that policies, not campaigns, are the biggest factors in determining presidential election outcomes.
Back-testing my methodology, which is based on extrapolating recent vote results out to the future, using vote trends established over a longer term, I correctly picked the winning candidate in the 2012 presidential election in 47 states and Washington D.C.

Based on the tremendous loss of Republican fortunes that had taken place in the State of Florida, I made a wrong prediction that Governor Scott would lose his 2014 reelection effort. I then mindlessly dismissed the significance of the failed pick by blaming the unexpected result on the different populations that choose to vote in off-year elections.
During the Florida primary season I became aware of a significant change in state policy which took place in late 2011 that may have been the reason for Governor Scott’s unexpected win, and a reason to change my 2016 presidential election prediction.
In the 2010 gubernatorial election, Florida’s Governor Scott captured 48.87% of the vote and received 61,550 more votes than his closest rival, Democrat Adelaide Alexander “Alex” Sink. The corresponding numbers in the 2014 gubernatorial election were nearly identical as Governor Scott defeated Charlie Crist with 48.14% of the vote and by a 64,145 vote margin. Not identical were the election results in Florida counties, which were amazingly dissimilar.
In fifteen of Florida’s 67 counties, Governor Scott experienced a combined 145,994 vote margin loss with Broward County being the biggest contributor with Governor Scott vote margin dropping by 49,395 votes in 2014 compared to 2010. Governor Scott’s vote margin increased by a collective 147,998 votes in Florida’s other 52 counties with Duval County leading the way with Governor Scott’s margin increasing by 19,404 votes in the county.
Examination of the election on a percentage basis showed that at one extreme, Governor Scott’s margin in Calhoun County increased by 27.2%, rising from an 8.0% margin of victory in 2010 to 35.2% margin of victory in 2014. At the other extreme, Governor Scott’s margin of victory in De Soto County fell by 8.6%, as Governor Scott won the 2014 election in De Soto County by a 5.2% margin, down from a 13.8% margin in 2010. These two counties were politically skewing away from each other by a combined margin shift of 35.2% in four years, or roughly 9% per year.
Why was there all this difference in the level of political support for the governor in the various counties and how does this apply to my 2016 presidential election prediction?
A state-wide anti-growth effort was initiated in Florida in the 1980s and became fully operational in 1995. These growth restrictions led to home prices rising considerably in many counties by the start of the last recession, with prices tripling in some, and doubling in most, high-demand areas of Florida.
Previous work had shown that counties with high median home prices generally become less Republican over time. The generally higher prices of homes resulting from the growth restrictions led Florida to fall from being the seventh most Republican state in the nation, based on the 1988 presidential election, to being the 25th most Republican state based on the 2012 presidential election.
![]()
The Florida legislature eliminated a significant portion of state involvement in growth restrictions as control of local development reverted back to the counties. This change took place in late 2011, a considerable time prior to the 2014 Florida gubernatorial elections. Could this change in policy have ended the trend of Republicans losing market share in Florida and be at least partially responsible for the unexpected reelection of Governor Scott in 2014?
There are 29 low-population counties in Florida where the median home prices are generally low. There is little demand for housing in these counties (highlighted by the fact that these counties collectively lost, according to the Census Bureau, a little less than six thousand residents from 2010 and 2015), and so it was not surprising to find that in these 29 counties, Governor Scott’s 2014 vote margin improved over his 2010 margin by a collective 26,875 votes and, on average, Governor Scott’s 2014 vote margins improved by 12% in these 29 counties when compared to the 2010 gubernatorial election.
There were also five high population counties with fairly high median home prices (Broward, Pinellas, Miami-Dade, Palm Beach, and Orange) where, again, it was not surprising, based on previous finding in similar counties over longer time frames, to see Governor Scott lose vote margin in these types of counties. Governor Scott collective margin loss was 122,597 votes in these five counties between 2010 and 2014.
When analyzing the vote data, it was noticed that Sumter County, a county with a fairly high median home price, and therefore a county that would have been expected to become more Democrat over time, had shifted to become much more Republican. In the 2010 Florida Gubernatorial election, Sumter County was carried by Governor Scott by a margin of 28.2%. In the 2014 election, Governor Scott’s margin in Sumter County jumped to 40.6%. This shift equated to Governor Scott’s 2014 margin increasing by 9,981 votes over his 2010 election margin in Sumter County. What could possibly have caused such an amazingly large shift in the gubernatorial vote in a county of only 118,891 inhabitants in just four years?
From 2011 through 2014, Sumter County averaged issuing 3068 single-family home building permits per year. With a population of 118,891, this works out to there being one single family home building permit issued for every 39 residents. The significance of this quantity of building permits issued in Sumter County can be observed by comparing the number of single-family building permits being issued in Sumter County to the number of these permits being issued in some states.
For instance, in 2015 the state of Connecticut issued 2,436 of these permits, Rhode Island; 841, West Virginia; 2,029, Vermont; 936, Hawaii; 2,356, New Hampshire; 2,424, and Maine; 2,835. In 2015 the state of New York, with a population of almost 20 million people, issued only 10,065 single family home permits, barely three times more permits than the number in Sumter County, again a county of just 118,891 souls.
The Sumter County results were similar to the results found in some other counties. Based on the 2010 and 2014 gubernatorial elections, Governor Scott’s vote margin increased by 3,149 votes in Walton County, 6,966 votes in Santa Rosa County, 4,284 votes in Nassau County, 6,504 votes in Collier County, and 10,710 votes in St. Johns County. All these counties had fairly high median home prices, but all had issued a high number of single-family building permits relative to the population of the counties.
It was also noted that in 2011 the number of single-family building permits issued in the State of Florida was 31,316. In 2013 and 2014, after the removal of much of the state oversight of growth, this number had risen to more than 50,000 annually, suggesting the policy change to remove the state approval process of development resulted in more permits being issued in the state as a whole. The findings in Sumter County suggest that this increase in the number of permits would result in Republicans improving market share over that experienced when lesser numbers of permits were being issued.
Not all counties which issued a high number of building permits relative to their population became much more Republican between 2010 and 2014.
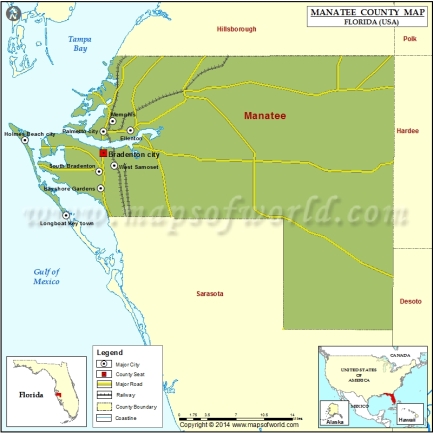
For example, Manatee County issued a relatively high number of single family home building permits for its population, but Governor Scott’s margin fell 2.1% from 2010 to 2014 in Manatee County as the county fell from being the 38th most Republican county in the state in 2010 based on the gubernatorial vote to being the 45th most Republican county in the state in 2014.
In keeping with the theme that political shifts in counties are tied to real estate related factors, other factors that may affect the vote shift other than median home price and the number of single family permits being issued are policies that add additional cost, but not value, to a home.
In a Wall Street Journal article addressing costs imposed on home builders (The Fees That Inflate Home Costs, by Chris Kirkham, July 23 – 24, 2016) Manatee County was noted for the approving of the increasing of its impact fees by 80% or more over the next three years. The imposing of Impact fees, which in many cases act as a tax on the creation of homes, would cause a decline in Republican market share owing to the resulting higher home prices. High impact fees may also be an indication of general hostility of local governments towards new homes being built within their county.
Also noted for being outside the norm was Duval County. Duval County, which comprises just the City of Jacksonville, became much more supportive of Governor Scott in 2014 than it was in 2010, rising from being the 45th most Republican county in the state to becoming the 41st most Republican county in the state. For Republicans to gain market share in a high-population county is a rarity. Governor Scott’s vote margin in Duval County increased by 19,404 votes in 2014 compared to 2010, and as previously noted, the voters of Duval County gave Governor Scott the largest vote increase of any county in the state.
Why the increase in Governor Scott’s vote margin in Duval County?
One clue may be discovered in an article in The Wall Street Journal (Permit Delays Choke Housing Supply, by Chris Kirkham, July 18, 2016). This article noted that the metro area of Jacksonville was ranked as the fifth best high-population county in the nation in the time it takes to get a building permit approved.
http://www.wsj.com/articles/building-permit-delays-choke-u-s-housing-supply-study-shows-1468661402
It takes just four months to procure a building permit in Jacksonville. To compare, in the metro area of Daytona Beach, which is located just a short distance south of Jacksonville in Volusia County; it took 10.71 months to procure a building permit. The conclusion drawn from these examples is that there are many real estate related policies that affect the electorate of a county.
With this newly gained knowledge of the affect that real estate related policies appear to have on the political orientation of the electorate it was noted that between 2013 and 2016 an estimated quarter-million building permits will have been issued in the State of Florida. How does this change my 2016 presidential election prognostication?
The issuing of 180,000 single-family building permits between 2010 and 2014 created enough Republican votes for Governor Scott to slightly increase his vote margin in his second gubernatorial election.
President Obama captured the state by a 74,309 vote margin in 2012, but in this 2012 to 2016 period, 70,000 more single-family building permits were issued than in the 2010-2014 timeframe. This increase in single-family building permits should decrease the 2016 Democrat nominee’s margin by roughly 56,000 votes, resulting in a razor-thin Democrat victory in 2016 (not as close as the 1784 votes that separated President Bush and Senator Gore in the original count in the 2000 presidential election, but close).
The state of North Carolina also has issued a significant number of building permits in the last four years. I had North Carolina being won by the Democrats in my original 2016 prediction. Based on the large number of single-family building permits being issued in North Carolina, I now predict that North Carolina will stay in Republican hands in 2016, so my new prediction is for the Democrat candidate to win the 2016 Electoral College vote 332 to 206.
Other closely contested states that issued significant numbers of building permits in the 2013-2016 timeframe that voted Democrat in 2012 are Colorado and Nevada.
The addition of significant third-party candidates are not factors dealt with in my presidential prediction methodology. Having two significant third-party candidates in the 2016 election may very well make my prognostication an exercise in futility. The 2016 presidential election is going to be an interesting election. I’ve heard say that there exists a Chinese curse that states something like; “May you live in interesting times!” Unfortunately, we do.