
Proposition: Campaigns are Insignificant in Determining Presidential Election Outcomes
Variation in Political Trends of the States
Part Three of a Five-Part Series by Stephen R. Meyer
THIS IS THE THIRD ARTICLE OF A SERIES GIVING BACKGROUND INFORMATION FOR A 2016 PRESIDENTIAL ELECTION PROGNOSTICATION. THE PREDICTION IS BASED ON THE OUTCOME OF THE 2012 PRESIDENTIAL ELECTION EXTRAPOLATED OUT TO 2016 USING TRENDS ESTABLISHED BY THE 1988 AND 2012 PRESIDENTIAL ELECTIONS.
Link to Part One:
Link to Part Two
There was great variability in the outcomes in the vote in the 2012 presidential election in the various states.
Variation in the outcome of a process proves the process is inadequate to accomplish the goals of the process. Whether manufacturing widgets, or campaigning for presidents, variation in the outcome of the process proves the inadequacy of the process.
In the 2012 presidential election, the states of Hawaii, Vermont, New York, Maryland and Rhode Island were carried by the Democrat nominee by margins that exceeded 25% while the Republican nominee’s margin exceeded 25% in the states of Utah, Wyoming, Oklahoma, Idaho, and West Virginia. This huge difference in election outcomes cannot exist if existing campaign strategies were significant in determining presidential election outcomes!
If campaigns were significant to political success, then the party with the superior campaign strategy would win every state.
The variation in the state votes in the 2012 presidential election proves presidential campaigns are not effective; the same cannot be said about long-term political strategies. Following is a chart showing how the various states were politically trending based on the 1988 and 2012 presidential elections.
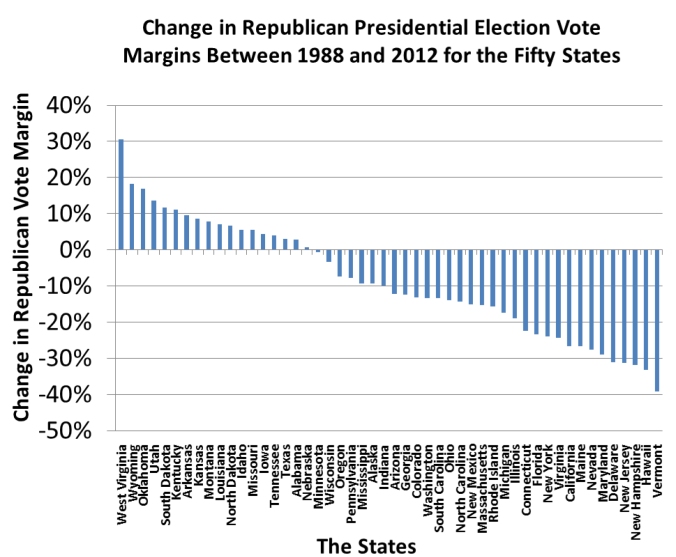
Only eighteen states were trending to become more Republican and these eighteen states were mostly small population states with a correspondingly low number of Electoral College votes. These trends reflect the substantial positive Electoral College vote trend being experienced by Democrats. In the 2012 presidential election, the Democrat nominee captured 329 Electoral College votes, up from the 112 Electoral College votes captured by the Democrat nominee in the 1988 presidential election.
The greater number of states, and the superior Electoral College advantage in the states that are trending to become more Democrat, suggests Democrats have much better strategies than do the Republicans.
There exist four possible combinations concerning the vote and vote trends given the existence of two major political parties. There can be; electorates which are voting majority Republican and trending to become more Republican, electorates which are voting majority Republican and trending to become less Republican, electorates which are voting majority Democrat and trending to become more Democrat, and finally electorates which are voting majority Democrat and trending to become less Democrat.
Tables showing how the states changed relative to each other are presented below. The first table is for the seven states which were carried by the Republicans in 2012, but which were trending to become more Democrat between 1988 and 2012. The states are listed in the tables from the least Democrat trending states to the most Democrat trending states.
| The Seven States Carried by the Republicans in 2012, but which were Trending to Become More Democrat Between 1988 and 2012 | 1988 Presidential Election Republican Margin of Victory | 2012 Presidential Election Republican Margin of Victory | 1988-2012 Presidential Election Republican Vote Margin Trend | Projected Republican (+) or Democrat (-) Margin in the 2016 Presidential Election Based on Extrapolating 2012 Presidential Election Results Out to 2016 Using Trends Established by the 1988 and 2012 Presidential Elections | 2012 -2020 Electoral College Votes for the Given State |
| Mississippi | 20.8% | 11.5% | -9.3% | +10.0% | 6 |
| Alaska | 23.3% | 14.0% | -9.3% | +12.4% | 3 |
| Indiana | 20.1% | 10.2% | -9.9% | +8.6% | 11 |
| Arizona | 21.3% | 9.0% | -12.3% | +7.0% | 11 |
| Georgia | 20.3% | 7.8% | -12.5% | +5.7% | 16 |
| South Carolina | 23.9% | 10.5% | -13.4% | +8.2% | 9 |
| North Carolina | 16.3% | 2.0% | -14.3% | -.3% | 15 |
| Total Electoral College Votes of this Group of States | 71 |
A second table is for the one state which was carried by the Democrats in 2012, but which was trending Republican between 1988 and 2012. It is a very short table, mostly reflecting the political dominance of the Republicans in 1988.
| The One State Carried by the Democrats in 2012, but which was Trending Republican Between 1988 and 2012 | 1988 Presidential Election Democrat Margin of Victory | 2012 Presidential Election Democrat Margin of Victory | 1988-2012 Presidential Election Republican Margin Trend | Projected Democrat Margin in the 2016 Presidential Election Based on Extrapolating 2012 Presidential Election Results Out to 2016 Using Trends Established by the 1988 and 2012 Presidential Elections | 2012-2020 Electoral College Votes for the Given State |
| Iowa | 10.2% | 5.8% | +4.4% | 5.1% | 6 |
A third table consists of those 17 states which were carried by the Republicans in 2012 and which were trending to become more Republican between 1988 and 2012.
| The 17 States Carried by the Republicans in 2012 and which were Trending to become more Republican Between 1988 and 2012 | 1988 Presidential Election Republican Margin of Victory* | 2012 Presidential Election Republican Margin of Victory | 1988-2012 Presidential Election Republican Margin Trend | Projected Republican Margin in the 2016 Presidential Election Based on Extrapolating 2012 Presidential Election Results Out to 2016 Using Trends Established by the 1988 and 2012 Presidential Elections | 2012-2020 Electoral College Votes for the Given Sate |
| West Virginia | -3.9% | 26.7% | +30.6% | 31.8% | 5 |
| Wyoming | 22.5% | 40.8% | +18.3% | 43.9% | 3 |
| Oklahoma | 16.6% | 33.5% | +16.9% | 36.4% | 7 |
| Utah | 34.2% | 47.9% | +13.7% | 50.2% | 6 |
| South Dakota | 6.3% | 18.0% | +11.7% | 20.0% | 3 |
| Kentucky | 11.6% | 22.7% | +11.1% | 24.5% | 8 |
| Arkansas | 14.2% | 23.7% | +9.5% | 25.3% | 6 |
| Kansas | 13.2% | 21.7% | +8.5% | 23.1% | 6 |
| Montana | 5.9% | 13.6% | +7.7% | 14.9% | 3 |
| Louisiana | 10.2% | 17.2% | +7.0% | 18.4% | 8 |
| North Dakota | 13.0% | 19.6% | +6.6% | 20.7% | 3 |
| Idaho | 26.1% | 31.7% | +5.6% | 32.6% | 4 |
| Missouri | 3.9% | 9.4% | +5.5% | 10.3% | 10 |
| Tennessee | 16.4% | 20.4% | +4.0% | 21.1% | 11 |
| Texas | 12.7% | 15.8% | +3.1% | 16.3% | 38 |
| Alabama | 19.3% | 22.2% | +2.9% | 22.7% | 9 |
| Nebraska | 21.0% | 21.8% | +0.8% | 21.9% | 5 |
| Total Electoral College Votes of this Group of States | 135 |
*Negative numbers represent a Republican loss.
The fourth and final table for this series is for the 25 states (and Washington D.C.) which were carried by the Democrats in 2012 and which were trending to become even more Democrat between 1988 and 2012.
| The 25 States and The District of Columbia Carried by the Democrats in 2012 and which were Trending to become more Democrat Between 1988 and 2012 | 1988 Presidential Election Democrat Margin of Victory* | 2012 Presidential Election Democrat Margin of Victory | 1988-2012 Presidential Election Democrat Margin Trend | Projected Democrat Margin in the 2016 Presidential Election Based on Extrapolating 2012 Presidential Election Results Out to 2016 Using Trends Established by the 1988 and 2012 Presidential Elections | 2012-2020 Electoral College Votes |
| Minnesota | 7.0% | 7.7% | 0.7% | 7.8% | 10 |
| Wisconsin | 3.6% | 6.9% | 3.3% | 7.5% | 10 |
| Oregon | 4.7% | 12.1% | 7.4% | 13.3% | 7 |
| Pennsylvania | -2.3% | 5.4% | 7.7% | 6.7% | 20 |
| Colorado | -7.8% | 5.3% | 13.1% | 7.5% | 9 |
| Washington | 1.5% | 14.8% | 13.3% | 17.0% | 12 |
| Ohio | -10.9% | 3.0% | 13.9% | 5.3% | 18 |
| New Mexico | -5.0% | 10.2% | 15.2% | 12.7% | 5 |
| Washington D.C. | 68.3% | 83.6% | 15.3% | 86.2% | 3 |
| Massachusetts | 7.8% | 23.1% | 15.3% | 25.7% | 11 |
| Rhode Island | 11.7% | 27.5% | 15.8% | 30.1% | 4 |
| Michigan | -7.9% | 9.5% | 17.4% | 12.4% | 16 |
| Illinois | -2.1% | 16.9% | 19.0% | 20.0% | 20 |
| Connecticut | -5.1% | 17.3% | 22.4% | 21.1% | 7 |
| Florida | -22.4% | 0.9% | 23.3% | 4.8% | 29 |
| New York | 4.1% | 28.1% | 24.0% | 32.1% | 29 |
| Virginia | -20.5% | 3.9% | 24.4% | 7.9% | 13 |
| California | -3.5% | 23.1% | 26.6% | 27.6% | 55 |
| Maine | -11.4% | 15.3% | 26.7% | 19.7% | 4 |
| Nevada | -21.0% | 6.7% | 27.7% | 11.3% | 6 |
| Maryland | -2.9% | 26.1% | 29.0% | 30.9% | 10 |
| Delaware | -12.4% | 18.6% | 31.0% | 23.8% | 3 |
| New Jersey | -13.6% | 17.7% | 31.3% | 22.9% | 14 |
| New Hampshire | -26.2% | 5.6% | 31.8% | 10.9% | 4 |
| Hawaii | 9.5% | 42.7% | 33.2% | 48.2% | 4 |
| Vermont | -3.5% | 35.6% | 39.1% | 42.1% | 3 |
| Total Electoral College Votes of this Group of States | 326 |
*Negative numbers represent a Republican win.
There were 14 states, and the District of Columbia, where the Democrats won by double digit margins in 2012 and which also experienced double digit trends of becoming even more Democrat based on the 1988 and 2012 presidential elections (an indication of political dominance) and these states, along with reliably Democrat voting populace of Washington D.C. account for 184 Electoral College votes, 68% of the270 Electoral College votes required for victory.
There were six states where the Republicans won by double digit margins in 2012 and which had double digit trends of becoming more Republican between 1988 and 2012 and these states accounted for 32 Electoral College votes, just 12% of the 270 Electoral College votes required for a Republican victory. The Democrats have more than five times the number of Electoral College votes categorized in this manner than do the Republicans.
When we add up the Electoral College votes based on the 2016 vote projections from the previously presented tables it can be seen that if the trends continue then the Democrats will capture the 2016 Electoral College election by a vote of 347 to 191.
There is even greater variation in the vote at the county level than exists at the state level. This variation will be addressed in the next article in this series.

Note: This map is not Mr. Meyer’s work. The template is courtesy of Paul Gurien, University of Georgia.
[Stephen Meyer is an author and political radio show host, who’s innovative methodology correctly predicted the winning candidate in 47 states and Washington D.C., along with President Obama’s overall victory in 2012. He resides in Vero Beach, Florida.]
